

U.S. electricity rates are up more than 25% since 2020 — and a growing share of those increases depend on when power is used, not how much. Scale’s advanced microgrids cut these costs without impacting your operations, with $0 down and savings from day one.
Solar only creates value by replacing utility energy at the moment it’s generated. Scale combines solar, battery storage, and intelligent controls to capture three distinct sources of value — without impacting your operations.
See your site’s value streamsPick a region, then build the system one asset at a time. Each chart models a manufacturing plant’s load over a single day, before and after Scale’s advanced microgrid gets to work.
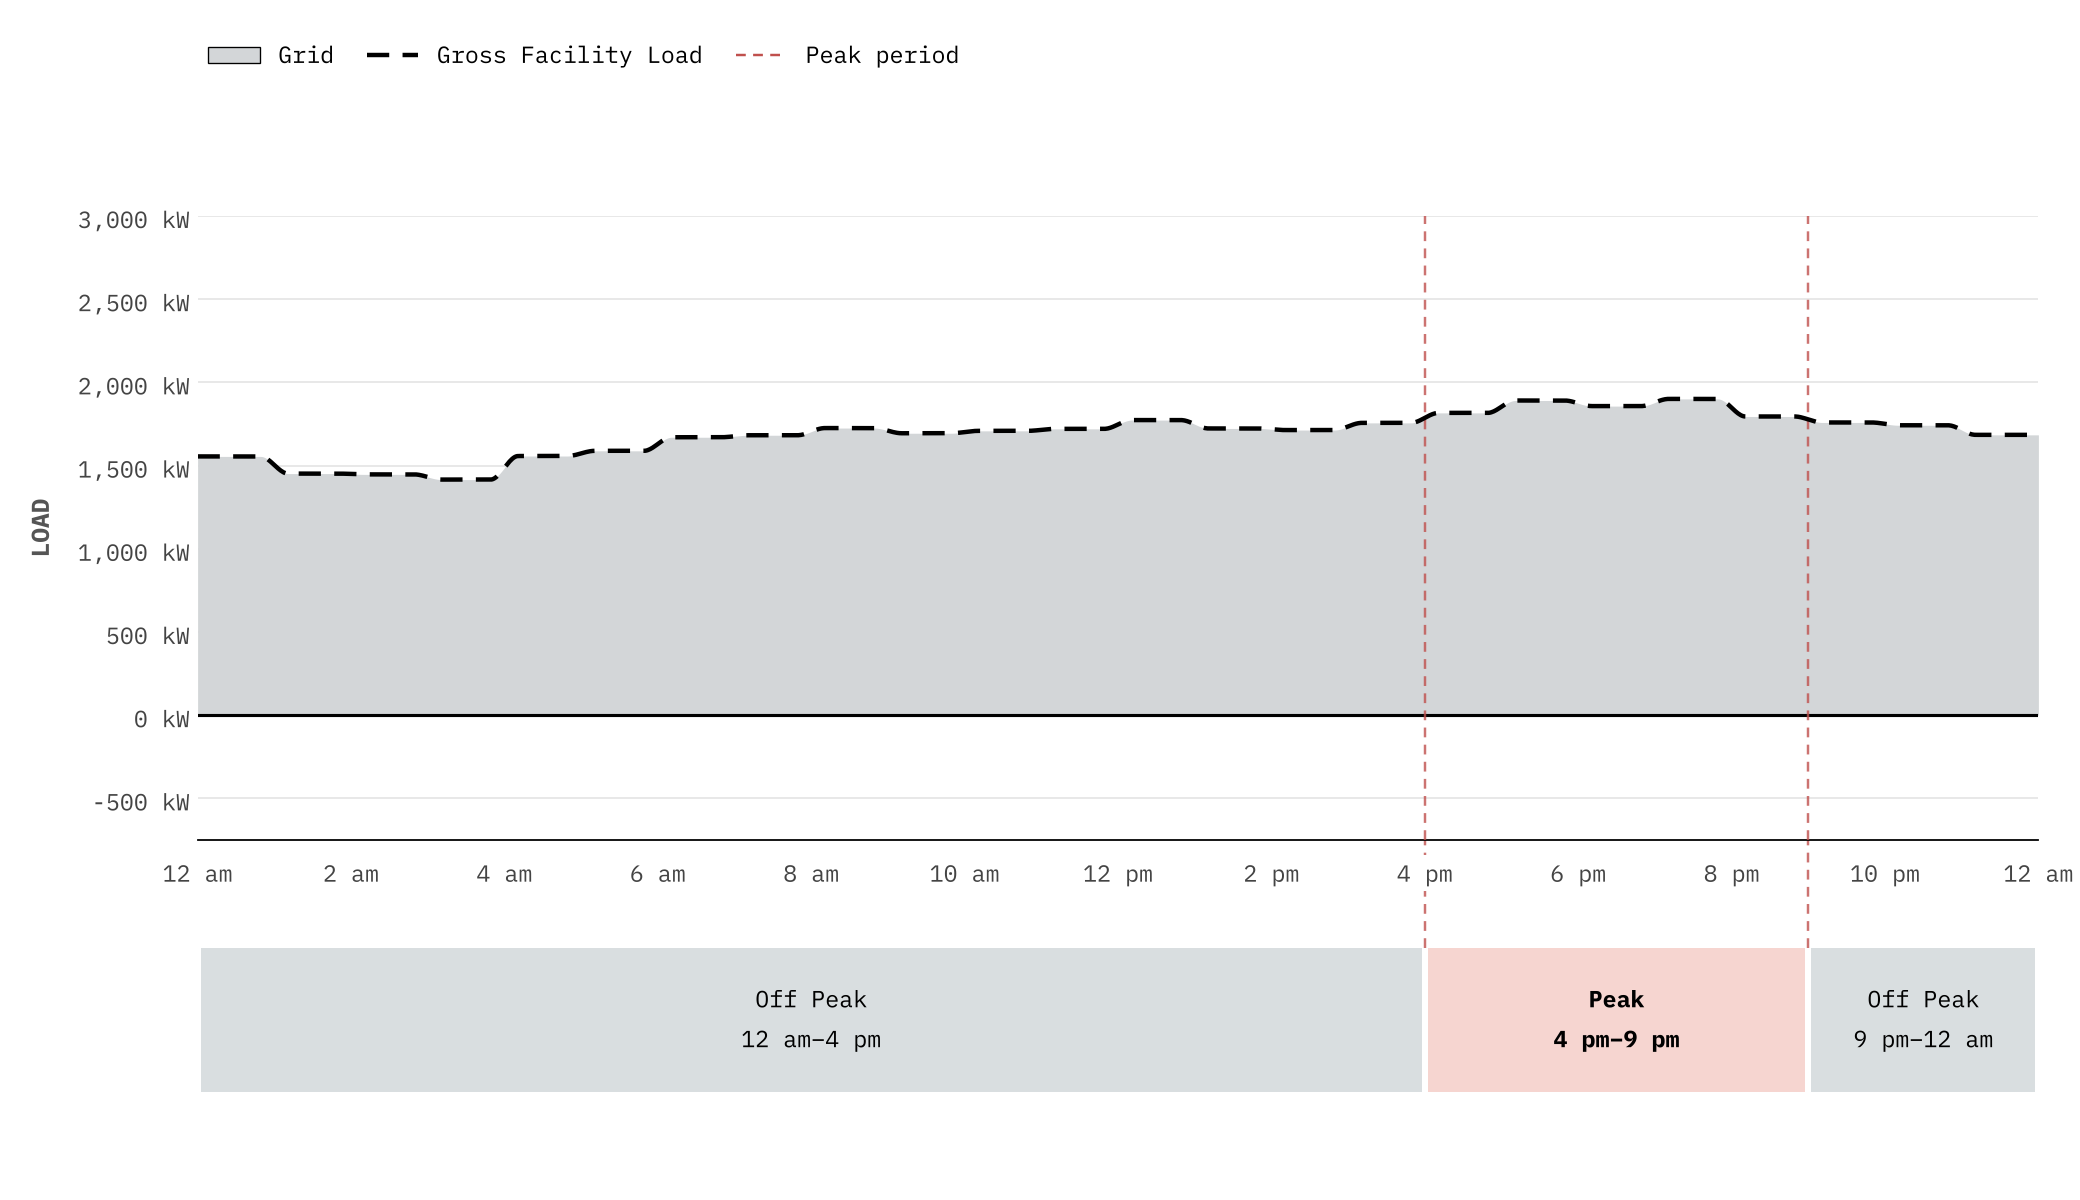
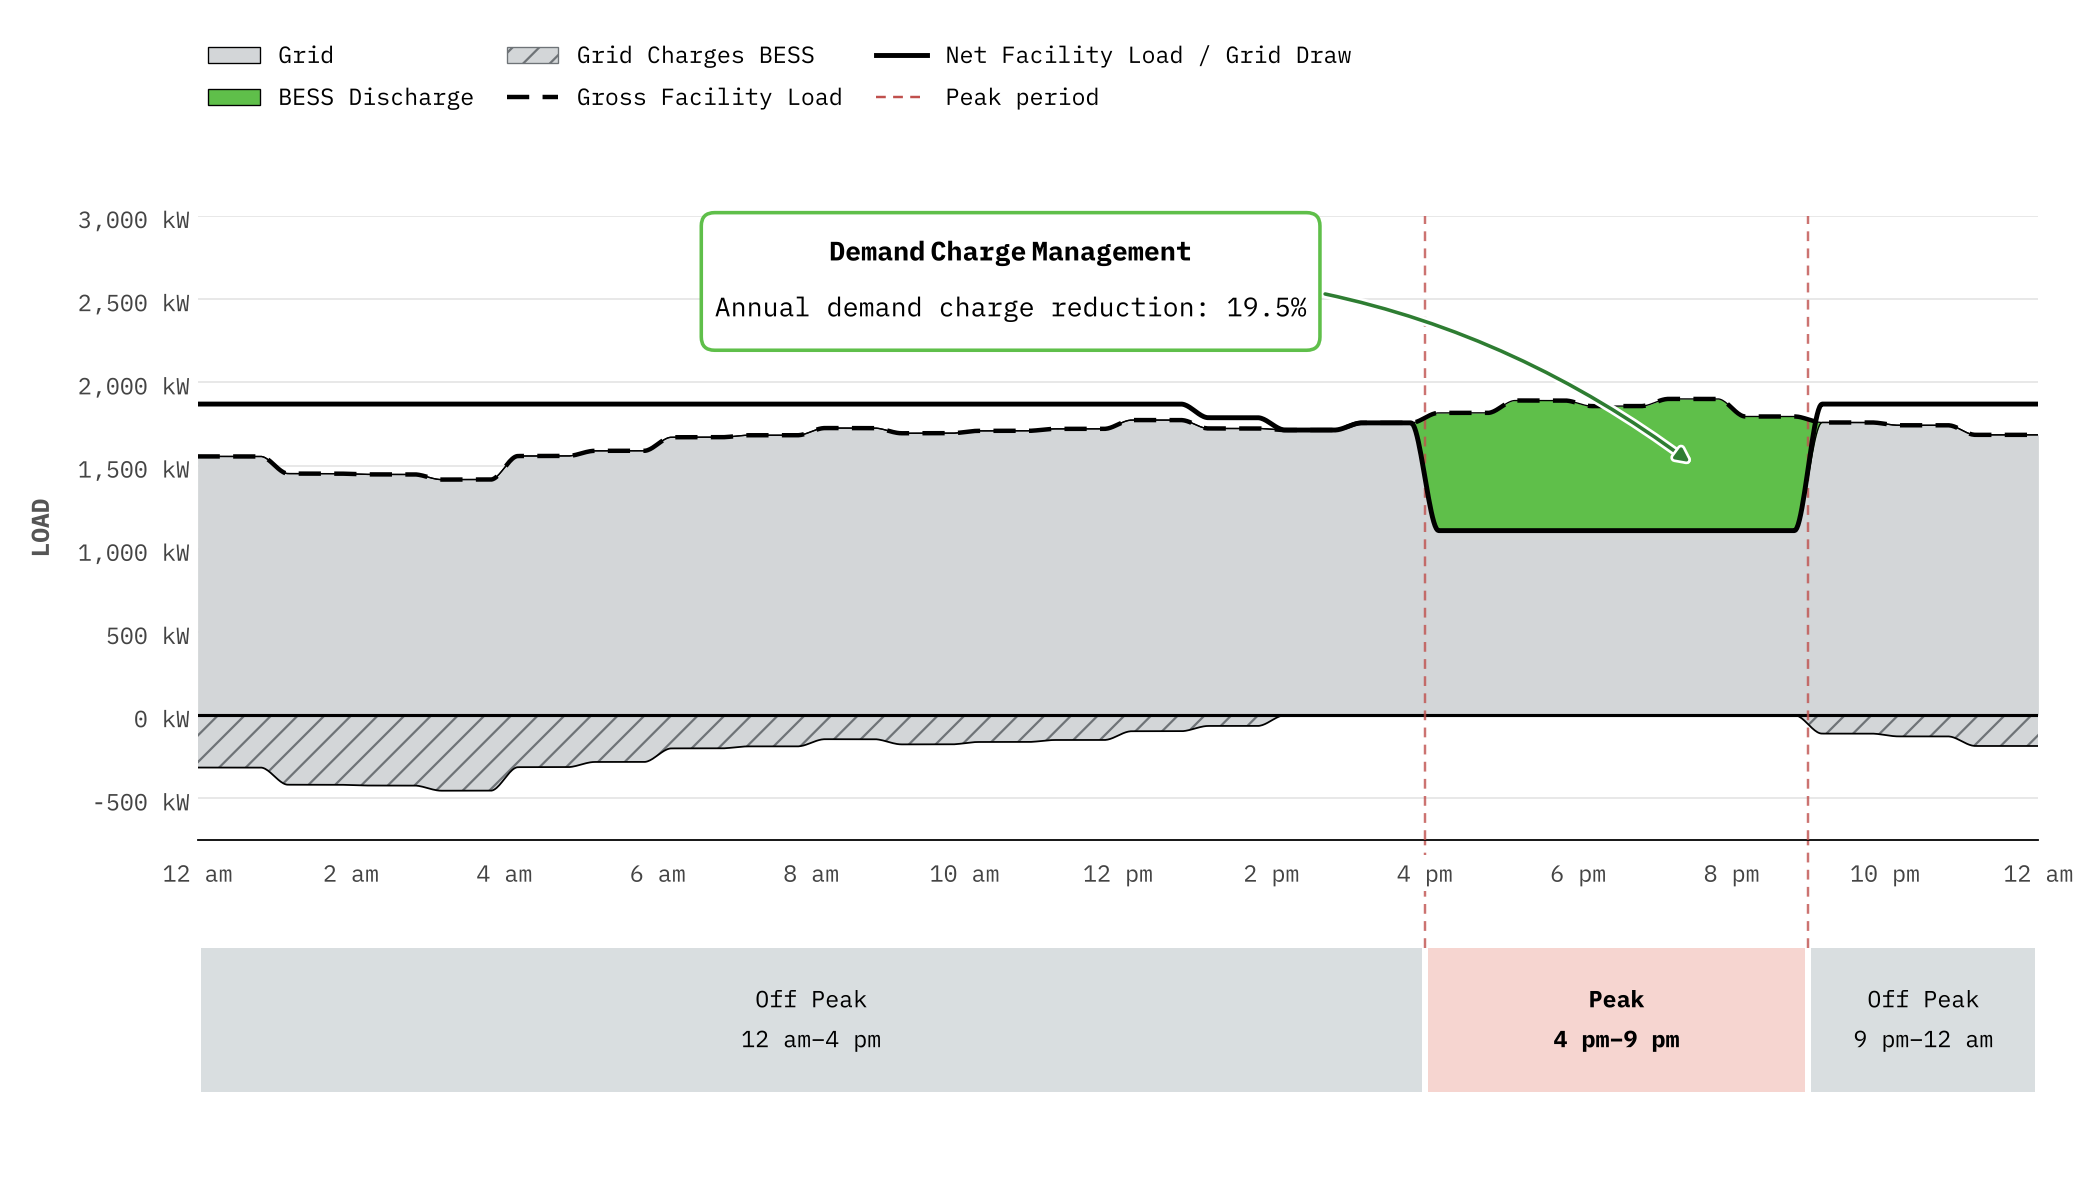
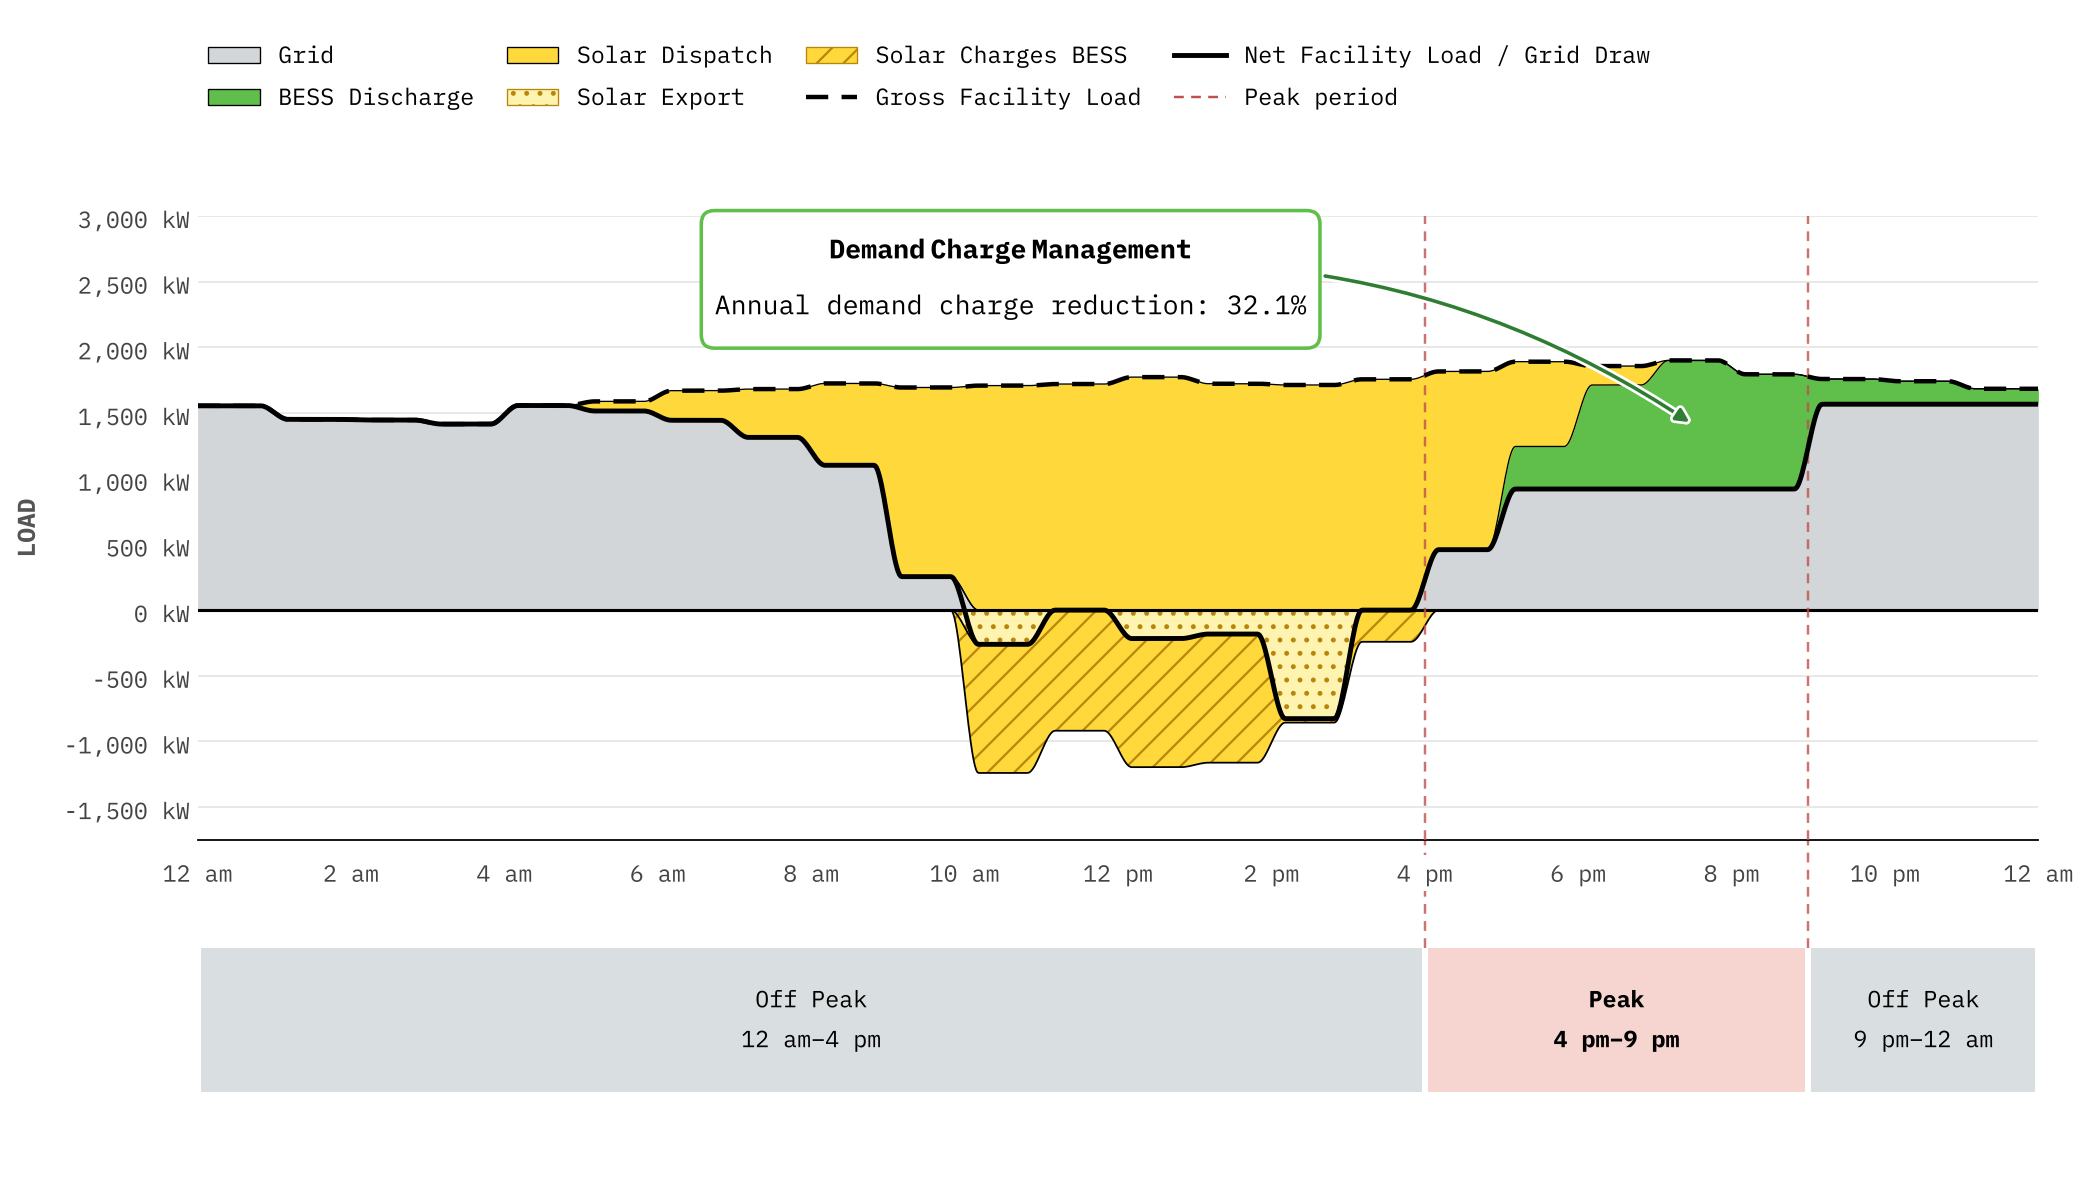
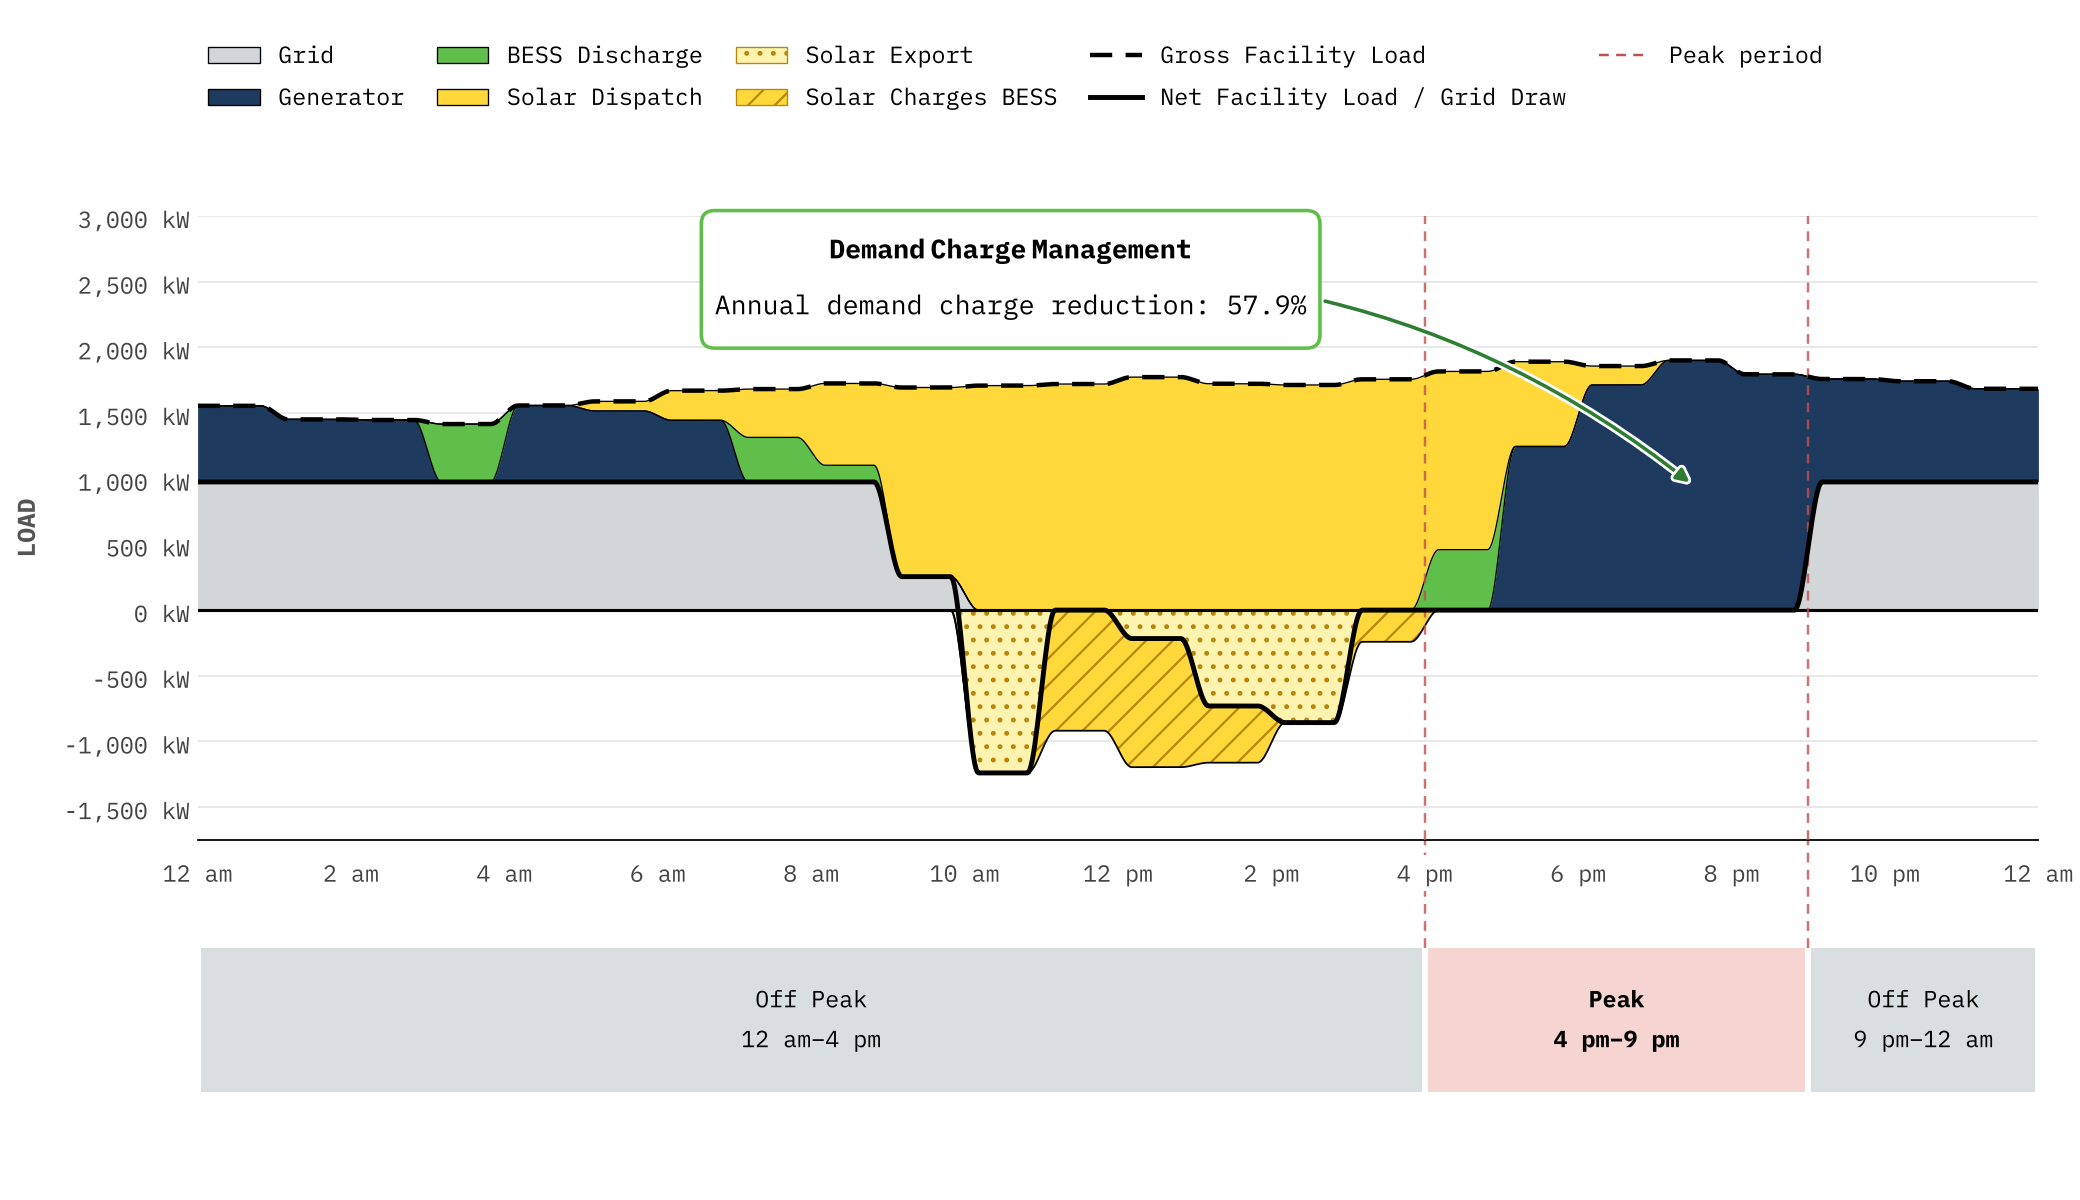
California businesses face high demand charges and time-of-use rates, with peak pricing from 4–9 pm.
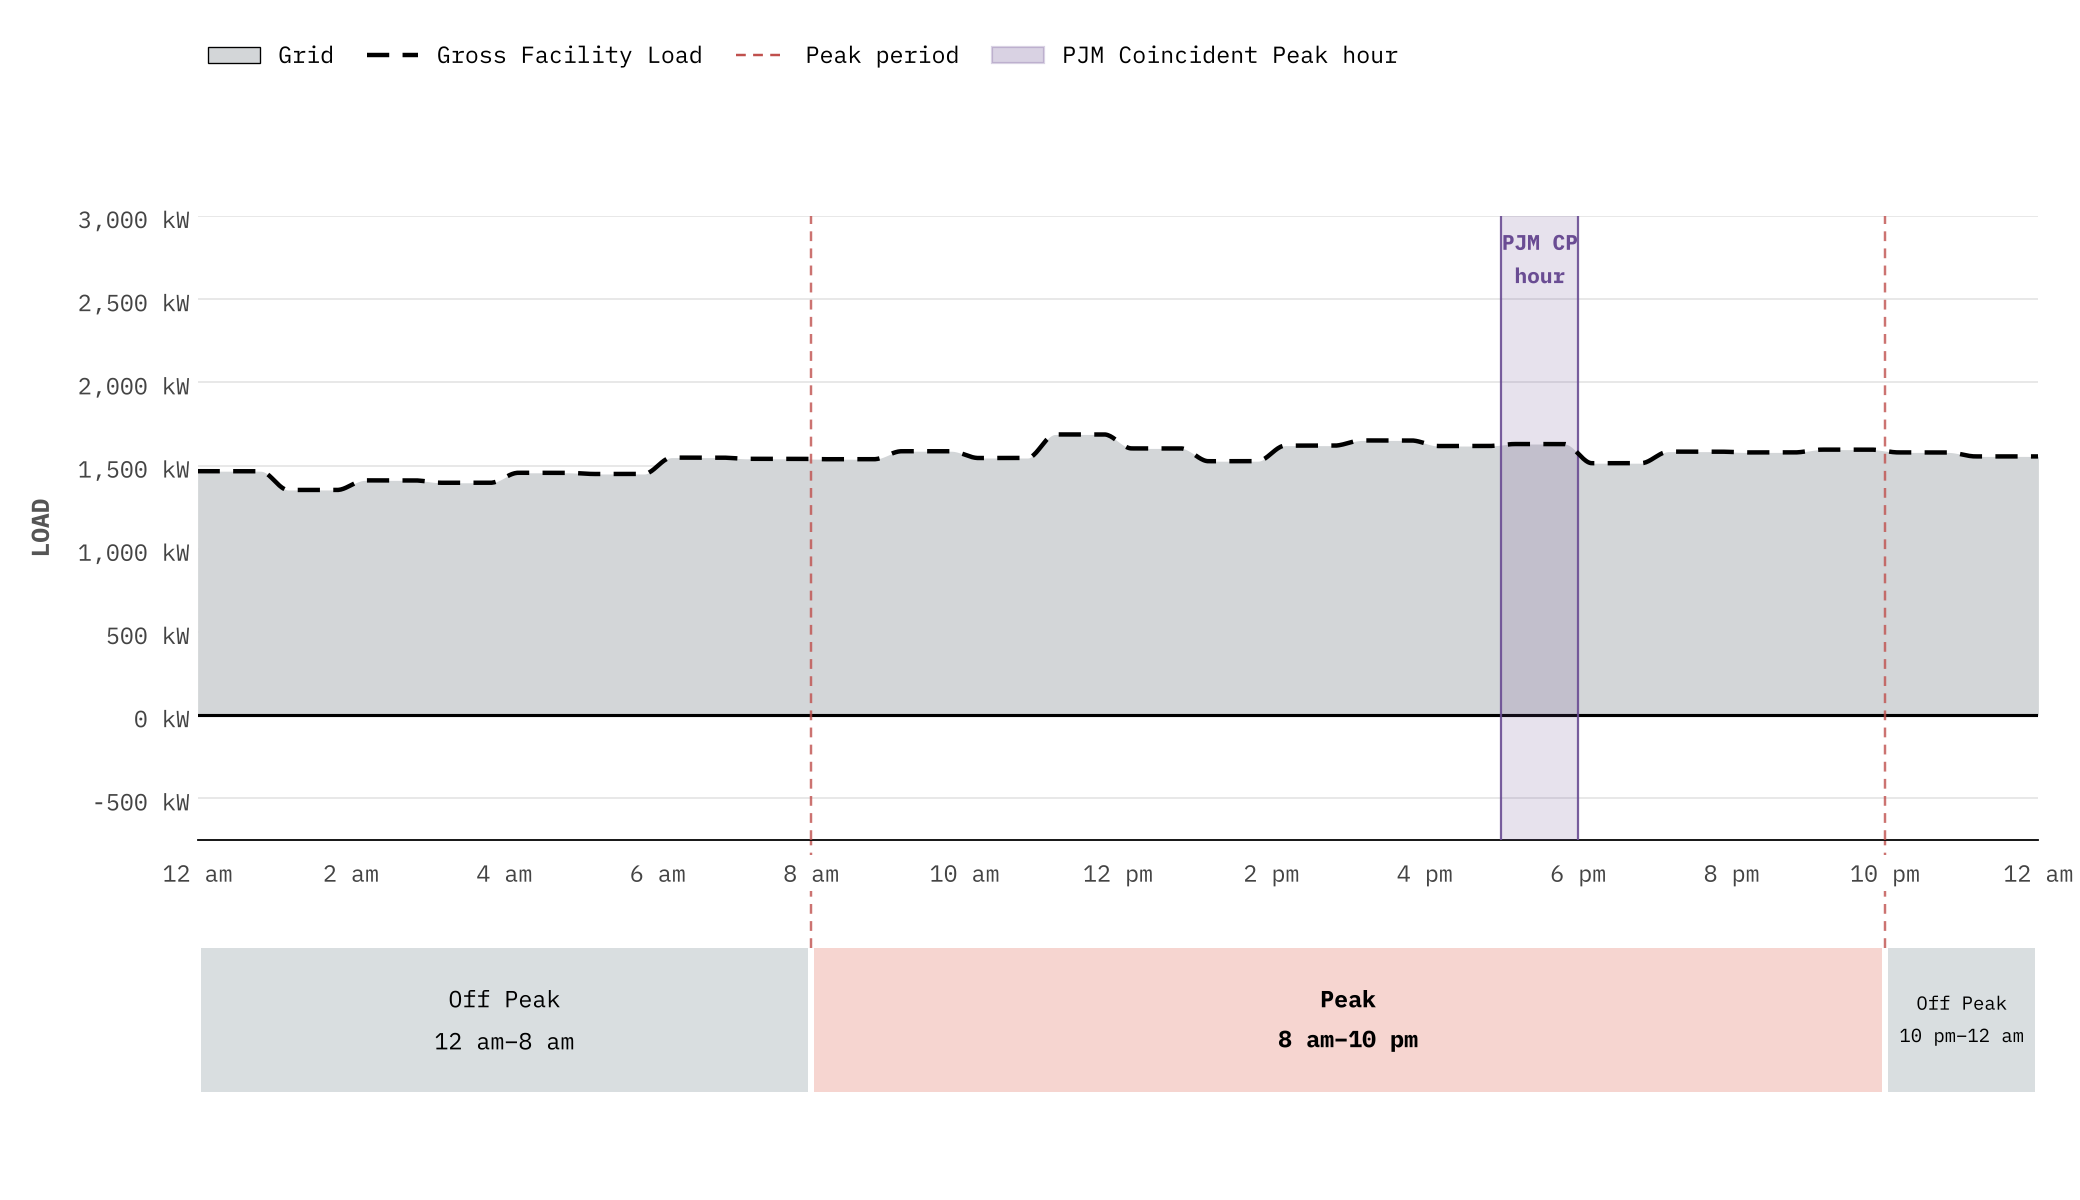
Without a microgrid, the plant draws every kilowatt from the grid — straight through the peak period.
California businesses face high demand charges and time-of-use rates, with peak pricing from 4–9 pm.
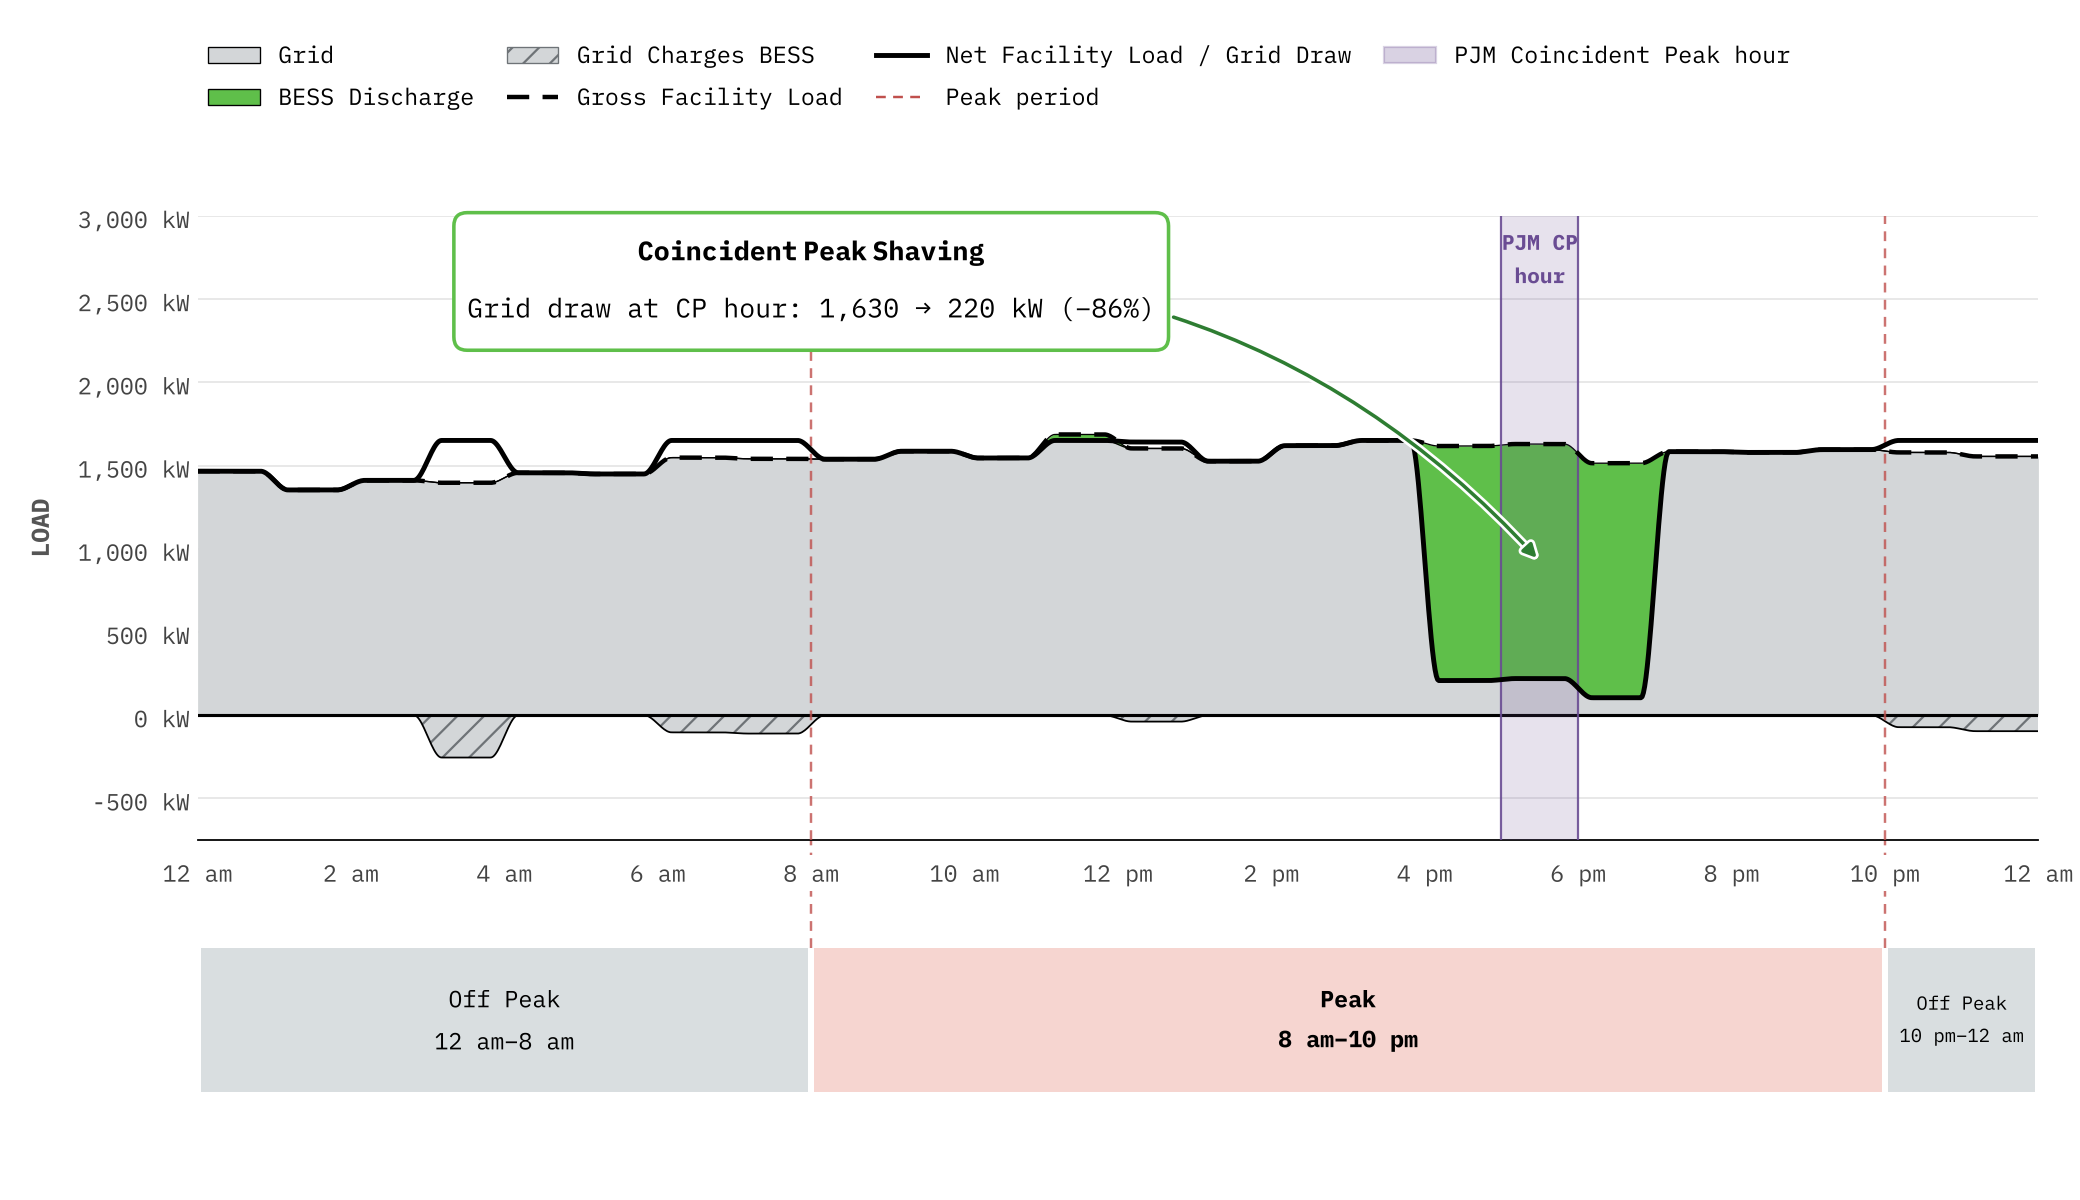
Battery storage shaves monthly demand peaks and shifts grid use to cheaper hours of the day.
California businesses face high demand charges and time-of-use rates, with peak pricing from 4–9 pm.
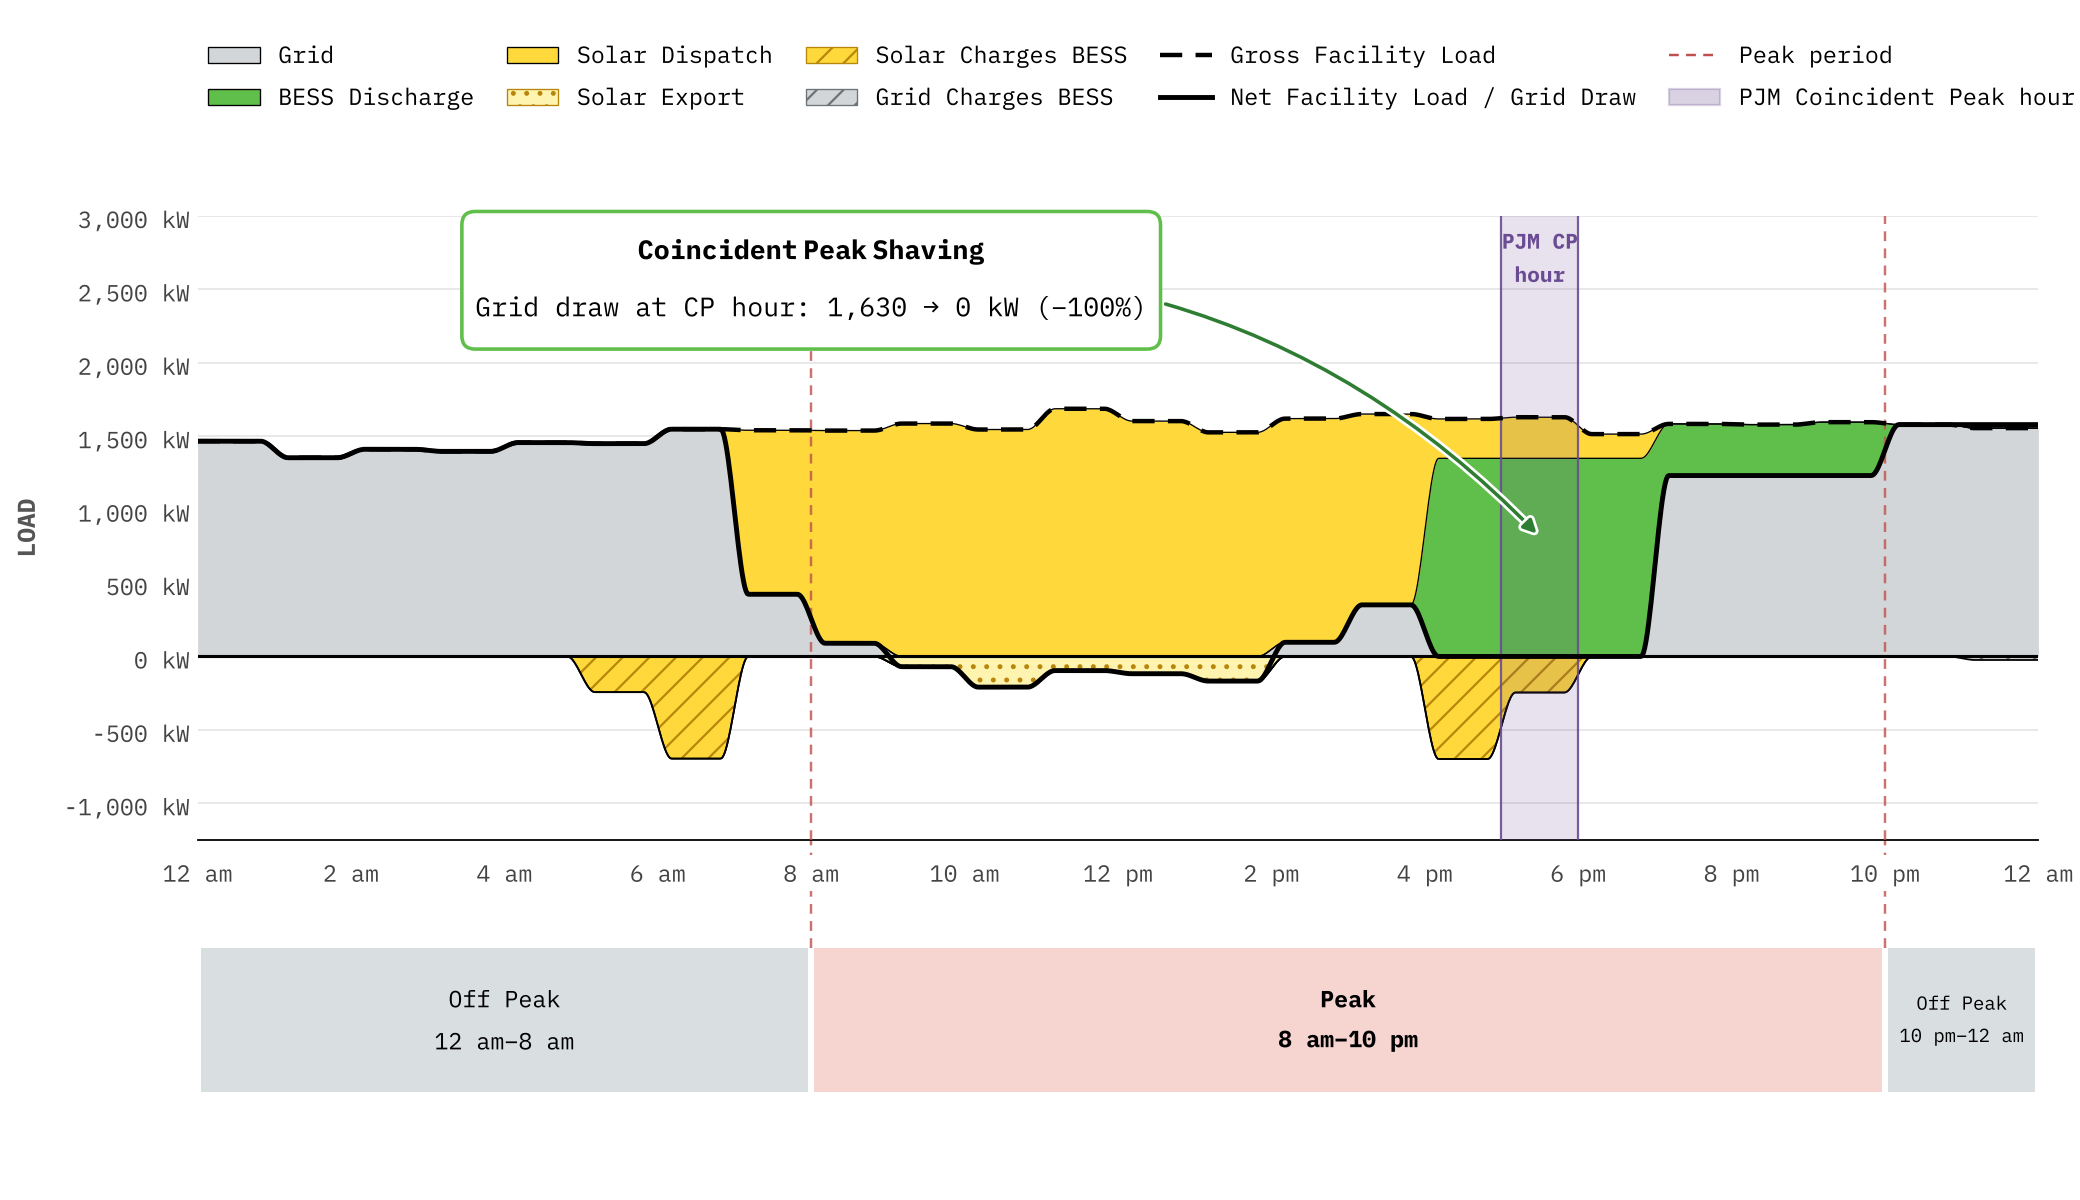
On-site solar cuts total grid purchases and can charge the battery, so stored energy is ready for the evening peak.
California businesses face high demand charges and time-of-use rates, with peak pricing from 4–9 pm.
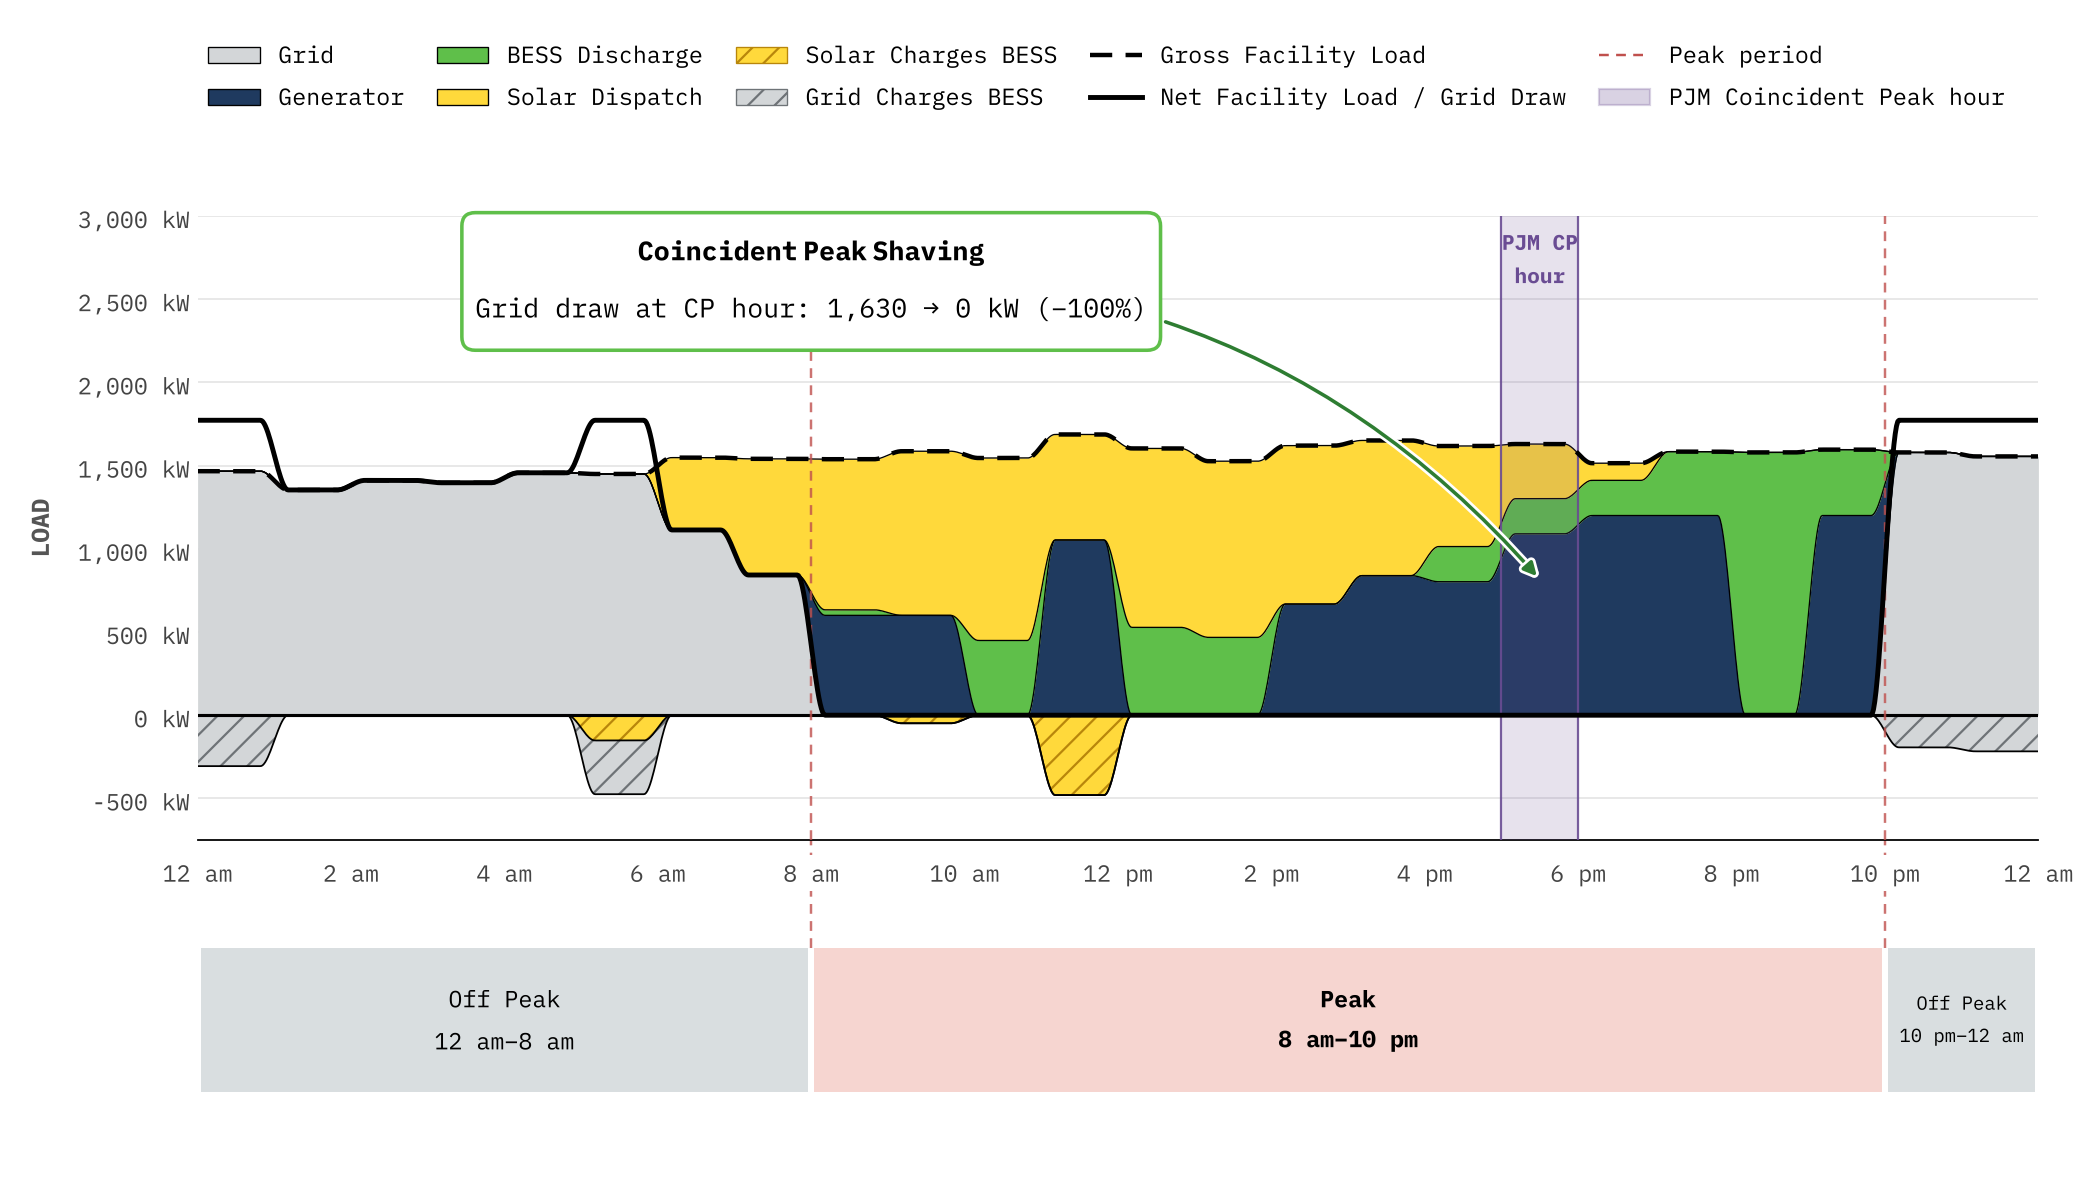
With solar, storage, and generation working together, Scale’s controls dispatch each asset when it creates the most value.
In PJM states like New Jersey and Illinois, coincident peak charges are driving cost increases across the mid-Atlantic.
Without a microgrid, the plant’s full load lands on the grid’s annual peak hour — the hour that sets its capacity and transmission charges.
In PJM states like New Jersey and Illinois, coincident peak charges are driving cost increases across the mid-Atlantic.
Battery storage targets the handful of peak grid hours each year to avoid the coincident peak charges driving up costs.
In PJM states like New Jersey and Illinois, coincident peak charges are driving cost increases across the mid-Atlantic.
Adding solar reduces the energy purchased from the grid throughout the day, on top of peak savings.
In PJM states like New Jersey and Illinois, coincident peak charges are driving cost increases across the mid-Atlantic.
In this model, the full microgrid takes grid draw during the PJM coincident peak hour from 1,630 kW to zero.
Your load profile and tariff are different — so your dispatch strategy will be, too. And as TOU windows shift, demand charges change, or new VPP programs launch, Scale re-optimizes dispatch across the life of the system.
Model my facilityOver 70% of businesses nationwide have seen electricity prices climb faster than inflation from 2020–2025. In the mid-Atlantic, average C&I rates are up well over 40%. In California, they’ve risen 50%.
But the bigger story is why — and how — they’re going up.
The cost of delivering electricity is growing faster than the cost of generating it.
Grid spending, plus regionally-specific factors like California wildfire costs and PJM capacity prices.
Source: Lawrence Berkeley National Laboratory
Replacing aging infrastructure, building new power lines, and hardening the grid against extreme weather are pushing the “delivery” portion of your bill higher.
Wildfire-related spending — including undergrounding power lines, vegetation management, insurance, and more — now add up to 15–25% of the costs passed on to ratepayers of the three biggest utilities in California.
From Maryland to New Jersey to Illinois, surging demand — driven largely by data centers — and fossil plant retirements have sent capacity costs soaring. The last three capacity auctions cleared at the market cap, locking in continued rate hikes for years to come.
Today's rate increases increasingly penalize businesses based on the timing of their demand on the grid — which is typically impossible to change without disrupting operations.
Higher prices during weekday hours of peak demand — typically mid-day, though in California peak rates have shifted toward early evening.
California’s “duck curve” — created by abundant mid-day solar production — has pushed peak pricing later in the day, weakening the economics of solar-only installations.
Billed monthly, based on your facility’s single highest demand interval (typically 15 or 30 minutes). For facilities with "peaky" load profiles it can add up to 70% of bills.
A demand charge is based on your highest rate of electricity use (in kW) during any single interval in the billing period. One spike can set the charge for the whole month.
Capacity and transmission charges based on your usage that "coincides" with the grid’s highest-demand hours each year.
Customers in regions like PJM are seeing some of the biggest increases, as new demand outpaces new generation amid coal plant retirements.

Scale’s Capital Solutions team pioneered microgrid-as-a-service contracts. Our Microgrid Service Agreement (MSA) is a turnkey agreement with a monthly service fee covering design, engineering, construction, operation, and maintenance for the life of the project.
The result: a volatile operating expense becomes a predictable, lower-cost line item — a built-in hedge against future rate increases.
Under our optional CFVS contract structure, Scale operates your microgrid to maximize total value — treating bill savings and grid revenue equally for the full project term. If a grid revenue opportunity is worth more than the bill savings it displaces, we can pursue it, because what matters is the combined number.
All value generated, from either source, goes to you up to an agreed sharing threshold — so grid revenue can fill the gap if bill savings ever underperform.
Value above the threshold is split at an agreed rate, keeping incentives permanently aligned. When a lucrative new VPP launches in your territory five years from now, we’ll re-optimize to participate — because we benefit when you do.
A demand charge is a monthly fee based on your facility’s highest rate of electricity use (in kW) during any single interval, typically 15 or 30 minutes, in the billing period. For roughly a third of businesses nationwide, demand charges make up more than 30% of their electricity bill.
Coincident peak charges, including capacity and transmission charges, are based on your facility’s energy use during the hours of highest demand on the grid each year. In regions like PJM, these charges are rising fast as new demand outpaces new generation.
An advanced microgrid combines solar, battery storage, and intelligent controls to shift when a facility draws power from the grid. That timing shift captures energy savings, demand and coincident peak savings, and grid services revenues at once, without changing how the facility operates.
An MSA is a $0 down, turnkey contract that covers designing, engineering, constructing, operating, and maintaining a microgrid for the life of the project. Customers pay a predictable service fee and start saving from day one, with no capital outlay.
Navigating today’s energy landscape takes an experienced copilot. Find out how an advanced microgrid could deliver optimized savings for your facility — from day one and for decades to come.


